


How to Calculate Areas Under the Normal Curve
Mathematicians have developed a table called the standard normal probability table, or the standard
probability distribution. We can use this table to make calculations.
Preliminary Background – the Standard Normal Probability Distribution
The Standard Curve

We have seen that there are an infinite number of forms representing normal (bell-shaped) curves.
One of them has the following characteristics:
- Its average is 0,
- Its standard deviation is 1.
A curve with these characteristics is called the standard curve.
The standard probability distribution table can calculate areas only within the standard curve. Fortunately, as we will see later, any normal curve can be converted into the standard curve.
Such a conversion is possible because all of the curves have the same area under them (=1).
Since the table can be used to calculate any area under the standard curve, it is also possible to automatically calculate any area in any other normal curve, which we will call the target curve. We will devote the following sub-chapters to the standard curve.
Characteristics of the Standard Normal Curve
As we stated previously, the standard curve reflects a normal probability distribution with expectation = 0 and standard deviation 1.
This means that the bell-shaped curve has its peak above 0 on the X axis, and the degree of its convexity corresponds to a standard deviation of 1. The units on the X axis reflect standard deviations.
They vary between 3 standard deviations to the right of 0 and 3 standard deviations to the left of 0.
A Reminder of the Characteristics of a Normal Curve 
Question: What is the probability of obtaining values less than 0?
The answer is 0.5.
Explanation: The bell-shaped curve is symmetric around 0, and the area under the curve totals 1.
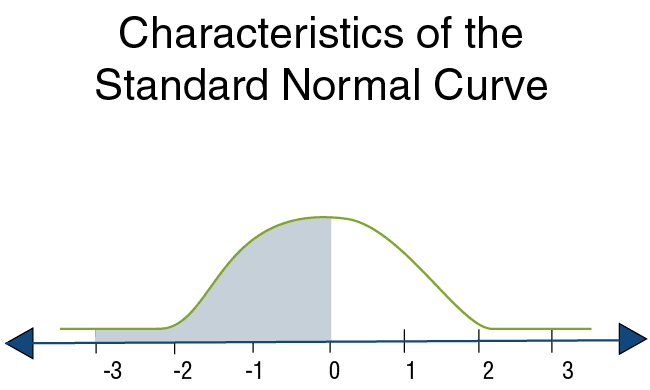
The area under the curve to the left of 0 is therefore exactly half the area under the curve, i.e. 0.5.
Question:
What is the probability of getting values greater than 0? 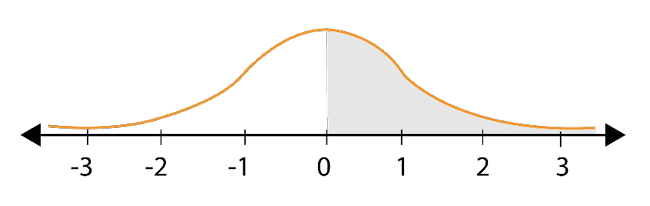
The answer is 0.5.


