


In our example, there will be three different parties interested in making use of the data for making decisions. These three parties are:
-
The school principal
-
A women’s organization
- The parents of one of the students
And each will use a different manner of data interpretation.
The School Principal
The school principal wishes to avoid gaps in grades between the two classes. If gaps exist, then he will act in various ways to narrow them. First, however, he must verify that such gaps exist. He will need the average grade of each class on each date, and the average annual grade for each class.
The school statistician gave the principal the following table:
The principal sees that according to the exams, and also in terms of the annual grade, the average scores of students in class 11-1 are better than those of students in class 11-2.
He considers the necessary steps that will raise the grades of students in class 11-2, so they will be equal to those of the students in class 11-1.
In order to obtain this table, the crude data must be organized in the following manner (by classes):
|
|
Class 11-1 |
Class 11-2 |
|
Average class grade on January exam |
76.55 |
71.36 |
|
Average class grade on April exam |
82.86 |
71.5 |
|
Average class grade on June exam |
77 |
75.91 |
|
Average annual class grade |
78.8 |
72.92 |
If we calculate the average of every column, and the annual average for each class, we will obtain the numbers that the statistician presented to the school principal.
|
Class 11-1 |
Class 11-2 |
|||||||||||||
|
Name |
January |
April |
June |
Name |
January |
April |
June |
|||||||
|
James |
78 |
99 |
80 |
George |
94 |
50 |
53 |
|||||||
|
Becky |
62 |
55 |
80 |
Benny |
92 |
91 |
72 |
|||||||
|
Craig |
97 |
72 |
99 |
Tony |
77 |
56 |
78 |
|||||||
|
Grace |
85 |
85 |
100 |
Dan |
66 |
81 |
67 |
|||||||
|
Ronnie |
61 |
83 |
72 |
Christiana |
71 |
74 |
95 |
|||||||
|
Shown |
51 |
90 |
95 |
Elizabeth |
49 |
61 |
87 |
|||||||
|
Dennis |
99 |
70 |
77 |
Christian |
85 |
62 |
55 |
|||||||
|
Benjamin |
63 |
86 |
81 |
Freddie |
95 |
86 |
84 |
|||||||
|
John |
60 |
98 |
58 |
Hillary |
67 |
95 |
71 |
|||||||
|
Ben |
65 |
87 |
80 |
Carlos |
50 |
62 |
93 |
|||||||
|
Britney |
77 |
86 |
70 |
Carl |
51 |
88 |
79 |
|||||||
|
Mel |
66 |
96 |
81 |
Leonard |
88 |
56 |
93 |
|||||||
|
Michael |
98 |
80 |
92 |
Dave |
58 |
92 |
79 |
|||||||
|
Sara |
55 |
86 |
90 |
William |
86 |
52 |
65 |
|||||||
|
Robbie |
75 |
96 |
76 |
Morgan |
69 |
71 |
94 |
|||||||
|
Allen |
87 |
81 |
100 |
Alex |
88 |
66 |
65 |
|||||||
|
Tommy |
84 |
61 |
51 |
Paul |
50 |
61 |
93 |
|||||||
|
Ralph |
89 |
90 |
85 |
Zippy |
78 |
54 |
78 |
|||||||
|
Maria |
57 |
95 |
55 |
Samuel |
81 |
82 |
89 |
|||||||
|
Bruce |
85 |
99 |
55 |
Rachel |
67 |
77 |
87 |
|||||||
|
David |
98 |
58 |
50 |
Matt |
60 |
93 |
49 |
|||||||
|
Tom |
91 |
70 |
67 |
Todd |
48 |
63 |
57 |
|||||||
The Women’s Organization
The women’s organization wishes to monitor how girls fare in this prestigious subject (physics), and their degree of success. What is needed in this case is the average grade for each gender separately on each date, and the average annual grade, as follows:
|
|
Boys |
Girls |
|
Number of students |
32 |
12 |
|
Average class grade on January exam |
75.48 |
69.36 |
|
Average class grade on April exam |
77.03 |
77.63 |
|
Average class grade on June exam |
74.76 |
81.55 |
|
Average annual class grade |
75.76 |
76.18 |
The women’s organization concluded that the girls were as successful as the boys in physics, and perhaps even a little more so. At the same time, the number of girls choosing to study this subject remains far less than the number of boys (i.e., 10 girls, as compared to 30 boys). The organization is considering a publicity campaign to encourage girls to study physics.
In order to reach this table, the crude data must be organized in the following manner (according to gender).
|
Boys |
Girls |
||||||
|
Name |
January |
April |
June |
Name |
January |
April |
June |
|
James |
78 |
99 |
80 |
Becky |
62 |
55 |
80 |
|
Craig |
97 |
72 |
99 |
Grace |
85 |
85 |
100 |
|
Ronnie |
61 |
83 |
72 |
Britney |
77 |
86 |
70 |
|
Shown |
51 |
90 |
95 |
Sara |
55 |
86 |
90 |
|
Dennis |
99 |
70 |
77 |
Maria |
57 |
95 |
55 |
|
Benjamin |
63 |
86 |
81 |
Christina |
71 |
74 |
95 |
|
John |
60 |
98 |
58 |
Elizabeth |
49 |
61 |
87 |
|
Ben |
65 |
87 |
80 |
Freddie |
95 |
86 |
84 |
|
Mel |
66 |
96 |
81 |
Hillary |
67 |
95 |
71 |
|
Michael |
98 |
80 |
92 |
Zippy |
78 |
54 |
78 |
|
Robbie |
75 |
96 |
76 |
Rachel |
67 |
77 |
87 |
|
Allen |
87 |
81 |
100 |
|
|
|
|
|
Tommy |
84 |
61 |
51 |
|
|
|
|
|
Ralph |
89 |
90 |
85 |
|
|
|
|
|
Bruce |
85 |
99 |
55 |
|
|
|
|
|
David |
99 |
58 |
50 |
|
|
|
|
|
Tom |
91 |
70 |
67 |
|
|
|
|
|
George |
94 |
50 |
53 |
|
|
|
|
|
Benny |
92 |
91 |
72 |
|
|
|
|
|
Tony |
77 |
56 |
78 |
|
|
|
|
|
Dan |
66 |
81 |
67 |
|
|
|
|
|
Christian |
85 |
62 |
55 |
|
|
|
|
|
Carlos |
50 |
62 |
93 |
|
|
|
|
|
Carl |
51 |
88 |
79 |
|
|
|
|
|
Leonard |
88 |
56 |
90 |
|
|
|
|
|
Dave |
58 |
92 |
79 |
|
|
|
|
|
William |
86 |
52 |
65 |
|
|
|
|
|
Morgan |
69 |
71 |
94 |
|
|
|
|
|
Alex |
88 |
66 |
65 |
|
|
|
|
|
Paul |
50 |
61 |
83 |
|
|
|
|
|
Samuel |
81 |
82 |
89 |
|
|
|
|
|
Matt |
60 |
93 |
49 |
|
|
|
|
|
Todd |
48 |
63 |
57 |
|
|
|
|
Tom’s Parents
Tom’s parents wish to get an idea of how Tom is progressing in his studies. They look at Tom’s grades on each date. Tom’s mother is a statistician, and she presented her son’s grades in a diagram.
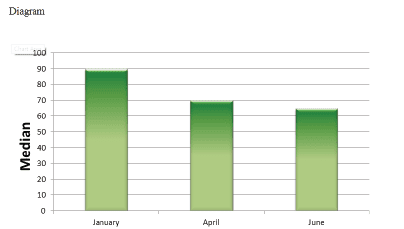
The diagram shows that Tom’s grades fell during the year.
The drop in Tom’s grades worried his parents, and they decided to send him to a private physics tutor, so that his command over the subject will improve by the time he takes his matriculation exam next year.
Summary
Three parties were involved in the above example of data interpretation.
Each party sorted the data in a way that suited them, analyzed the data and drew conclusions according to their interests.


