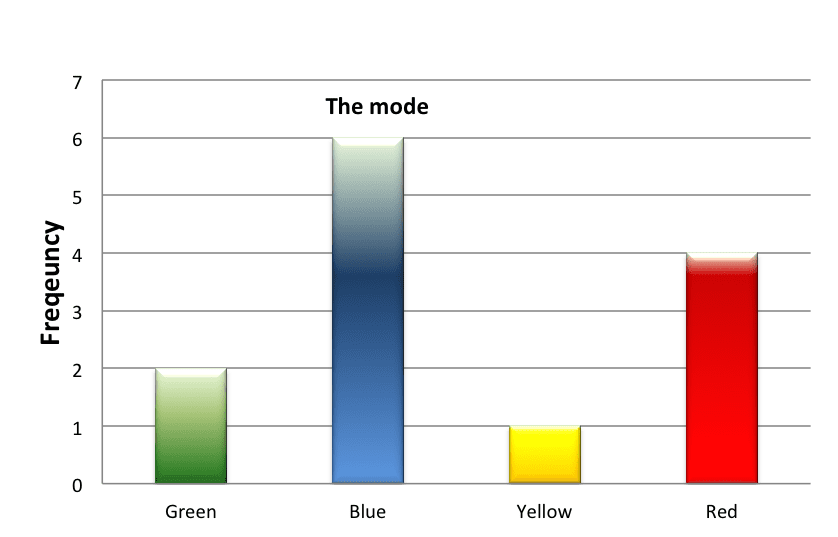
The mode represents the value that appears most frequently in the sample.
Diagram

Example 1:
In the distribution of gender that we examined in the preceding chapter, there were 22 women and 8 men. The mode is “women”.
|
Value (Job Status) |
Frequency |
||
|
|
Male |
Female |
Total |
|
Junior rank |
4 |
13 |
17 |
|
Intermediate rank |
2 |
6 |
8 |
|
High (senior) rank |
2 |
3 |
5 |
|
Total |
8 |
22 |
30 |
Question: What is the mode in the distribution of the number of children?
|
Value (number of children) |
Frequency |
|
0 |
5 |
|
1 |
6 |
|
2 |
10 |
|
3 |
7 |
|
4 |
2 |
|
Total |
30 |
The mode is 2, because it has the highest frequency; it appears the most times – 10 times. Note that the mode must be the value itself, i.e. 2, not the number of time that it appears.
Example 2:
When the distribution varies continuously, we will first calculate the relative density of the divisions by dividing the relative frequency of each division by its width. The division with the greatest density is called the modal division.
We will examine, for example, the following continuous distribution:
|
Division |
Frequency |
Relative Frequency |
Width of the Division |
Density (column 3 divided by column 4) |
|
0-3 |
12 |
6% |
3 |
6/3 = 2 |
|
3-10 |
42 |
21% |
7 |
21/7 = 3 |
|
10-20 |
70 |
35% |
10 |
35/10 = 3.5 |
|
20-26 |
48 |
24% |
6 |
24/6 = 4 |
|
26-40 |
28 |
14% |
14 |
14/14 = 1 |
|
Total |
200 |
100% |
|
|
The division with the highest density is the 20-26 division, which makes it the mode division.
Now that we have identified the mode division, we will try to find a single value within the division that best represents that division. This value will be the mode. What is the representative value of this division?
The representative value of each division reflects the midpoint value. We can calculate this by adding the lowest value of the division to its highest value, and then dividing by 2. Since the lowest value of the division is 20 and its highest value is 26, then the representative value is 23, which is also the mode.


