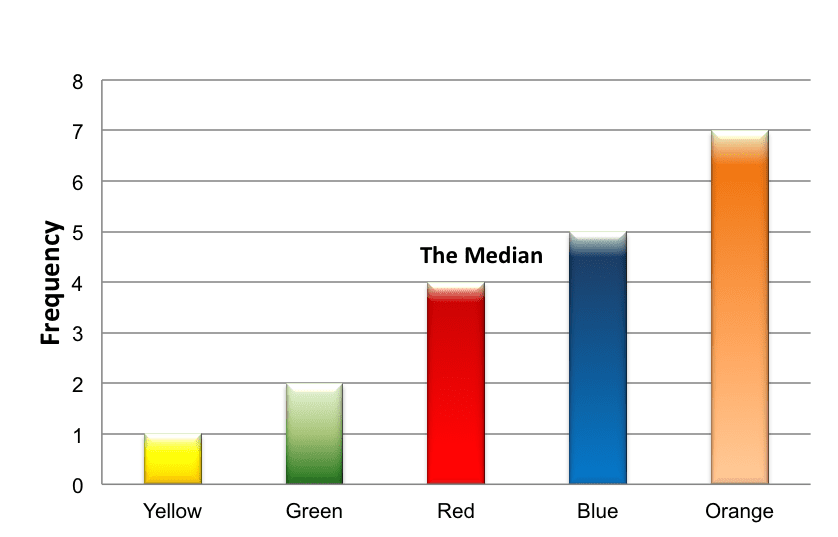
When we have a series of data that can be organized in increasing order, then the figure in the center of the row is called the median.
Diagram

We will explain this through examples:
For example, we have sorted the heights of 11 pupils in increasing order, as follows:
|
0.99 meters |
1.00 meters |
1.01 meters |
1.05 meters |
1.07 meters |
1.08 meters |
1.09 meters |
1.11 meters |
1.12 meters |
1.15 meters |
1.16 meters |
|
☺ |
☺ |
☺ |
☺ |
☺ |
☺ |
☺ |
☺ |
☺ |
☺ |
☺ |
|
1 |
2 |
3 |
4 |
5 |
6 median |
7 |
8 |
9 |
10 |
11 |
|
|
||||||||||
The median indicates the height of the middle pupil, i.e., the pupil who has the same number of pupils both below and above him. In our example, this is the sixth pupil since there are five pupils shorter than him, and five pupils taller than him.
The height of the sixth pupil is 1.08 meters, and the median is therefore 1.08 meters.
Another example –
When a group has 10 pupils, then there aren’t any pupils with the same number of pupils both below and above any given student’s position, but we can ascertain the median in the following manner:
In any even numbered group there will always be a pair of pupils with the same number of pupils below and above them. In a group of 10 pupils, pupils 5 and 6 represent this pair and 1.075 is the median.
|
1 |
2 |
3 |
4 |
5 |
6 |
7 |
8 |
9 |
10 |
|
☺ |
☺ |
☺ |
☺ |
☺ |
☺ |
☺ |
☺ |
☺ |
☺ |
|
|
|
|
|
1.07 meters |
1.08 meters |
|
|
|
|
The median represents the height of the “virtual” pupil located between pupils 5 and 6. The height of the virtual pupil reflects the average height of the pair from the perspective of each of its sides. There are 5 pupils located above and below this virtual pupil. Since the heights of pupils 5 and 6 are 1.07 meters and 1.08 meters respectively, then the average is 1.075 meters, and the median is therefore 1.075 meters.
Calculating the Location of the Median in a Data Sequence
In order to determine the location of the median, add 1 to the number in the data, and then divide by 2.
In an odd-numbered series (11 pupils): (11+1)/2 = 6
In an even-numbered series (10 pupils): (10+1)/2 = 5.5
Note: 5.5 relates to a virtual pupil located between pupil 5 and pupil 6.
Why the Median is Insufficient as a Measure of Centrality
We will consider the following example:
Five 10th grade pupils are examined according to their scores in a literature course, and they receive the following marks:
67, 68, 70, 70, and 72.
Since the number of observations is odd, then the median indicates the value in the third place: (5+1)/2 = 3, which means that the median is 70. A week later, two more pupils, who had been ill on the original examination date, are examined and each receives a score of 100. The revised list of marks is as follows: 67, 68, 70, 70, 72, 100, and 100. We will determine the median of the revised distribution: since there are seven observations, then the median value will be located in the fourth position: (7+1)/2 = 4, i.e., the median is 70.
Even though the distribution has changed radically (i.e., previously all of the marks were in the vicinity of 70, and now two hundred have been added), the median has not changed. The picture of the distribution provided by the median is incomplete and sometimes extremely distorted. We therefore need to find another measure that will describe the distribution more accurately. The average represents one such measure. It provides the relative weight of each value in the distribution, whereas the median emphasizes only the locations of the sample values. For this reason, the average figure in the revised list of marks should be higher than the average of the initial list since the additional marks were higher.


