


Another Example
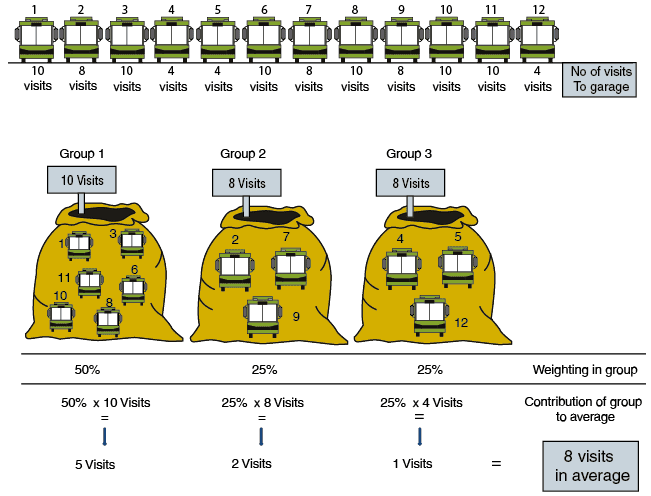
A bus company operates a fleet of 12 buses.
Six of them were purchased seven years ago, three others were purchased three years ago, and the remaining three were purchased one year ago. All of the buses visit the garage several times each year. At the end of the year, the company owner checks the number of times that the buses were in the garage.
He finds that each of the seven-year-old buses had been in the garage 10 times each during the year, each of the three-year-old buses had been in the garage eight times during the year, and each of the new (one- year-old) buses was in the garage four times during the preceding year. The question is how many times each bus visited the garage on average.
We will organize the data using an illustration. In this example, each group has another characteristic (in addition to the number of visits to the garage), i.e., the age of the buses in the group.
Sometimes we add the additional characteristic to the table in order to better present the data, as can be seen in the following table (column no. 2), which summarizes the data from the example:
|
Numbering of the Group |
Age of the buses (the additional characteristic) |
Visits to the Garage (the value) |
No. of Items in Each Group (the frequency) |
Weight of the Group (the relative frequency) |
Contribution of the Group to the Average |
|
(1) |
(2) |
(3) |
(4) |
(5) |
(6) = (3) x (5) |
|
Group 1 |
7 years |
10 visits |
6 |
50% |
5 visits |
|
Group 2 |
3 years |
8 visits |
3 |
25% |
2 visits |
|
Group 3 |
1 year |
4 visits |
3 |
25% |
1 visit |
|
Total |
|
|
12 |
100% |
8 visits |
There were on average 8 visits to the garage per vehicle.
Note for the Table:
Columns no. 1 and 2 are not necessary for calculaton of the average. These columns have been added for reasons of convenience and completeness of the table.


