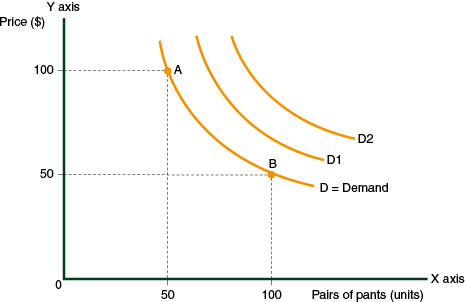
The name of each economic curve explains what that curve represents. In our example using the Demand Curve Diagram, the name of the curve is the demand curve for trousers in Country A.
Every curve is also accompanied by a symbol consisting of one or two letters. The letters chosen for each curve usually come from the term that describes the curve. In this case, the curve represents a demand curve, so the letter D is used to represent it.
We usually place the symbol at the top or the bottom of every curve, but it also can be placed near the curve, with an arrow used to indicate the association between the symbol and the curve. Since there are many demand curves in the demand curve diagram, we identify one of them with a number.
The diagram includes demand curves for Country A, Country B, and Country C. Each curve is therefore represented as follows:
-
D represents the demand curve for Country A.
-
D1 represents the demand curve for Country B.
- D2 represents the demand curve for Country C.