


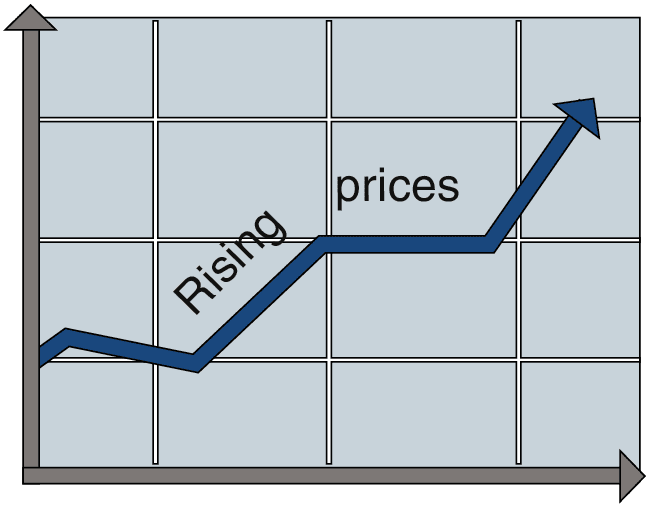
Inflation is a term for a continuous process of rising prices over a period of years. The inflation rate is the rate at which the general level of prices in the economy rises. It is also a synonym for the increase in the monthly Consumer Price Index published by the USA Central Bureau of Statistics.
Financial statements adjusted for inflation
Financial statements adjusted for inflation reflect the company’s monetary activity, assuming that all of that activity took place at the level of prices in the month of the financial statements (if the financial statements are for December 31, 2007, the values in them are “adjusted” to the price level of December 2007).
In order to explain and demonstrate how the financial statements are adjusted for inflation, it will be assumed that the financial statements are the annual statements for December 31, 2008.The true inflation rate between each of the months in 2008 and the month of the financial statements (December 2008) will be used for this purpose. These inflation rates are as follows:
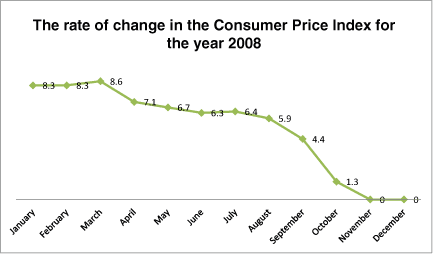
In order to ensure that everything is clear, the meaning of the numbers in the first row of the table will be explained.
During the period from January 2008 until December 2008, the general price level rose by 8.3%, i.e. every $100 in January 2008 was “equal in value” to $108.30 (100 x 1.083) in December 2008.
How the Items in the Financial Statements are Adjusted for Inflation Balance sheet
Profit and loss statement:
The annual profit and loss statement adjusted for inflation is a statement in which the sales item and the various expenditures items (cost of sales, management and general expenditures) undergo adjustment of monetary values that reflect the level of prices in December.
The items for each month increase (or decrease) according to the changes in the price index from the month in which they were created until December of that year. This will be illustrated in the sales item of the USA Furniture Company on the next page.
USA Furniture’s sales in 2008 were as follows:
- January 2008 – $10,000
- May 2008 – $50,000
- December 2008 – $30,000
Total: $90,000
The sales items adjusted to the price index in December 2008 are as follows:
- January 2008 – $10,830 ($10,000 + 8.3%)
- May 2008 – $53,350 ($50,000 + 6.7%)
- December 2008 – $30,000 ($30,000 + 0%)
Total: $94,180
It can be seen in this example that USA Furniture’s sales in 2008 totaled $90,000 – the monetary proceeds that the company actually received (or is due to receive).
In the profit and loss statement adjusted for inflation, however, the sales item is $94,180 – the monetary value that reflects the company’s sales, had all those sales taken place in the last month of the year.
Balance sheet
In the balance sheet adjusted for inflation, only some of the balance sheet items are adjusted through December. Some of the items retain their original values.
Fixed assets:
The sums in this item are adjusted for inflation, i.e. fixed assets increase (or decrease) in value according to changes in the price index from the month in which the assets were purchased until the month of the balance sheet date. Assume that USA Furniture bought a machine for $5,000 in August 2008. This machine will be listed under the fixed assets item at a value of $5,295 in the balance sheet for December 31, 2008 (5,000 + 5.9% = 5,295).
Fixed assets purchased by the company in previous years must also be adjusted to the price level of December 2008. For example, if the company bought equipment for $25,000 in 1995, and the price index rose by 20% from that time until December 2008, then this equipment will be listed at $30,000 (25,000 + 20%) in the balance sheet for December 31, 2008.
Inventory:
Sums in this item are adjusted for inflation, i.e. inventory increases (or decreases) according to changes in the price index from the month in which the inventory was purchased until the month of the balance sheet date.
Accounts Receivable
The sums in this item are not adjusted for inflation and they retain their original values. The reason is that the sums in the “AR” item reflect what the company’s customers owe to it. They will pay the company exactly those sums, even if the payment occurs two or three months later.
For example, if USA Furniture sells products for $20,000 in October 2008, the customer’s debt to the company at the end of 2008 is still $20,000. There is no need to “adjust” this value to accommodate the rate of inflation subsequent to the sale (At any time, it is sufficient for the customer to pay the company $20,000 in order to eliminate this debt).
Accounts Payable
The sums in this item are not adjusted for inflation and they retain their original values. The reason is that the sums in the “AP” item reflect what the company owes to its suppliers. The company will pay its suppliers exactly those amounts, even if the payment occurs two or more months after the debt was created.
For example, if USA Furniture buys products for $10,000 in April 2008, its debt to the supplier at the end of 2008 will still be $10,000. There is no need to “adjust” this value to the rate of inflation after the debt was created (at any time, it is sufficient for the company to pay the supplier $10,000 in order to eliminate its debt).
Loans
The sums in this item are not adjusted for inflation and they retain their original values. The reason for this is that the sums in the “loans” item reflect what the company owes to a bank or other party.
The company will pay the lender exactly that sum, even if the payment occurs two or more months after the debt was created (linkage and interest are listed in a separate item).
Comparison with financial statements from previous years
When a company presents its financial statements for a given date, it lists next to each item the monetary value of that item for that date, and also what its monetary value was in a previous period (or several previous periods.)
For example, USA Furniture’s financial statements (balance sheet and profit and loss statement) for 2007 will include the monetary values of the preceding year, as follows:
USA Furniture’s Balance Sheet as of December 31, 2007 (Sums in thousands of $)
|
Assets |
Liabilities + Equity |
||||
|
|
December |
December |
|
December |
December |
|
Current Assets |
|
Current Liabilities |
|
||
|
Cash |
10 |
12 |
AP |
15 |
10 |
|
Inventory |
5 |
8 |
Long-term Liabilities |
||
|
Fixed Assets |
|
Loans |
15 |
20 |
|
|
Machine |
20 |
20 |
|
|
|
|
|
|
|
Equity |
5 |
10 |
|
Total |
35 |
40 |
Total |
35 |
40 |
USA Furniture’s Profit and Loss Statement for 2007 (Sums in thousands of $)
|
|
Year 2007 |
Year 2006 |
|
Revenues |
110 |
100 |
|
Cost of sales |
60 |
70 |
|
Gross profit |
50 |
30 |
|
Selling expenses |
10 |
10 |
|
Operating profit |
40 |
20 |
|
General and administrative expense |
10 |
10 |
|
Net profit |
30 |
10 |
In financial statements adjusted for inflation, the values of the preceding year are also adjusted to the date of the last balance sheet. For example, if the balance sheet date is December 31, 2007, all the relevant values (for both 2006 and 2007) are adjusted to the price index for December 2007.


