| Market dATA | |
| DJ Index | 100 points |
| Prices | |
| Call 100 | $1,000 |
| Put 90 | $1,800 |
| Call 110 | $500 |
Strategy name:
Short “Butterfly”.
Recommended use of strategy
Expectation of a high level of DJ Index volatility. This strategy is similar to the Long “Straddle” strategy, but the loss is smaller if our forecast does not come to fruition. Of course, the profit is also smaller, if the forecast does come to fruition.
Strategy components
This strategy is a combination of 4 different Call options.
Buying 2 Call options on-the-money and writing 2 different Call options, one in-the-money and one outside-the-money at equal intervals from the current index.
Example: Buying 2 Call 100 options and writing a Call 110 and writing a Call 90 option.
Expenses / Income from building the strategy
Income of $300.
Preliminary explanation: There is a rule which relates to 3 Call options with differing strike prices, but the strike price of one of them (the mid-option) is the average of the strike indexes of the other two.
The rule states that the price of the “mid-option” is lower than the average price of the other two options. In our example: $1,000 < $1,150.
According to this rule if we sell 2 options with differing strike prices (in this case 110 and 90) and we buy 2 options at the average strike price (100). We will remain with money in hand, in our example $300.
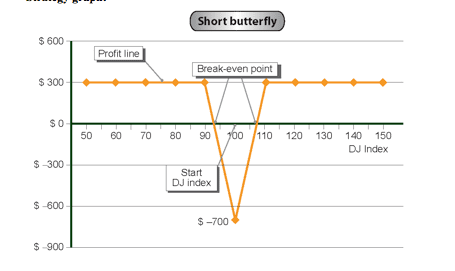
Strategy graph:

Strategy analysis:
Source of profit
We profit from the two Call options we have written. When the index is less than 90, all the options expire without value and we are left with a profit of $300.
When the index is at 110 or higher, the loss is fully offset by the profit from the options we bought, and we are left with a profit of $300.
Source of loss
The loss comes from the Call 90 options which we wrote. The maximum loss occurs when the index is at 100 points and all the options apart from this option, expire without value.
Break-even point
This occurs when the index is at 107 points or at 93 points.
Auxiliary table for building the profit line
|
DJ Index (Horizontal axis) |
(Fixed expense) / fixed income |
Variable expenses (from writing options) |
Variable income (from buying options) |
Total profit / (loss) (Vertical axis) 2+3+4 |
|
|
|
|
|
|
|
50 |
$300 |
– |
– |
$300 |
|
60 |
$300 |
– |
– |
$300 |
|
70 |
$300 |
– |
– |
$300 |
|
80 |
$300 |
– |
– |
$300 |
|
90 |
$300 |
– |
– |
$300 |
|
100 |
$300 |
($1,000) |
– |
($700) |
|
110 |
$300 |
($2,000) |
$2,000 |
$300 |
|
120 |
$300 |
($4,000) |
$4,000 |
$300 |
|
130 |
$300 |
($6,000) |
$6,000 |
$300 |
|
140 |
$300 |
($8,000) |
$8,000 |
300 |
|
150 |
$300 |
($10,000) |
$10,000 |
$300 |


