


For better learning, we use an example to introduce to you the concept of calculating standard deviation.
In country A, a competition is held every year to choose the champion half-court basketball shooter.
Every basketball team sends one representative to the competition. Each contestant in the competition shoots 10 times from half court. The winner of the competition (the person who makes the most baskets) receives a prize of $1 million, and his team’s coach gets the same amount.
On the Dream Team basketball team, the coach chooses his representative from among four outstanding players, using the following method:
-
He has each player take five rounds of 10 half-court shots each.
-
He chooses the player with the highest average in the five rounds.
The following table shows the results of the rounds of shots by the players:
Table 3.14
| Player 1 | Player 2 | Player 3 | Player 4 | |
| Results of round 1 | 1 basket | 3 baskets | 6 baskets | 8 baskets |
| Results of round 2 | 0 baskets | 2 baskets | 4 baskets | 2 baskets |
| Results of round 3 | 2 baskets | 4 baskets | 6 baskets | 8 baskets |
| Results of round 4 | 0 baskets | 0 baskets | 4 baskets | 1 baskets |
| Results of round 5 | 2 baskets | 6 baskets | 5 baskets | 6 baskets |
| Total baskets | 5 baskets | 15 baskets | 25 baskets | 25 baskets |
| Average per round | 1 basket | 3 baskets | 5 baskets | 5 baskets |
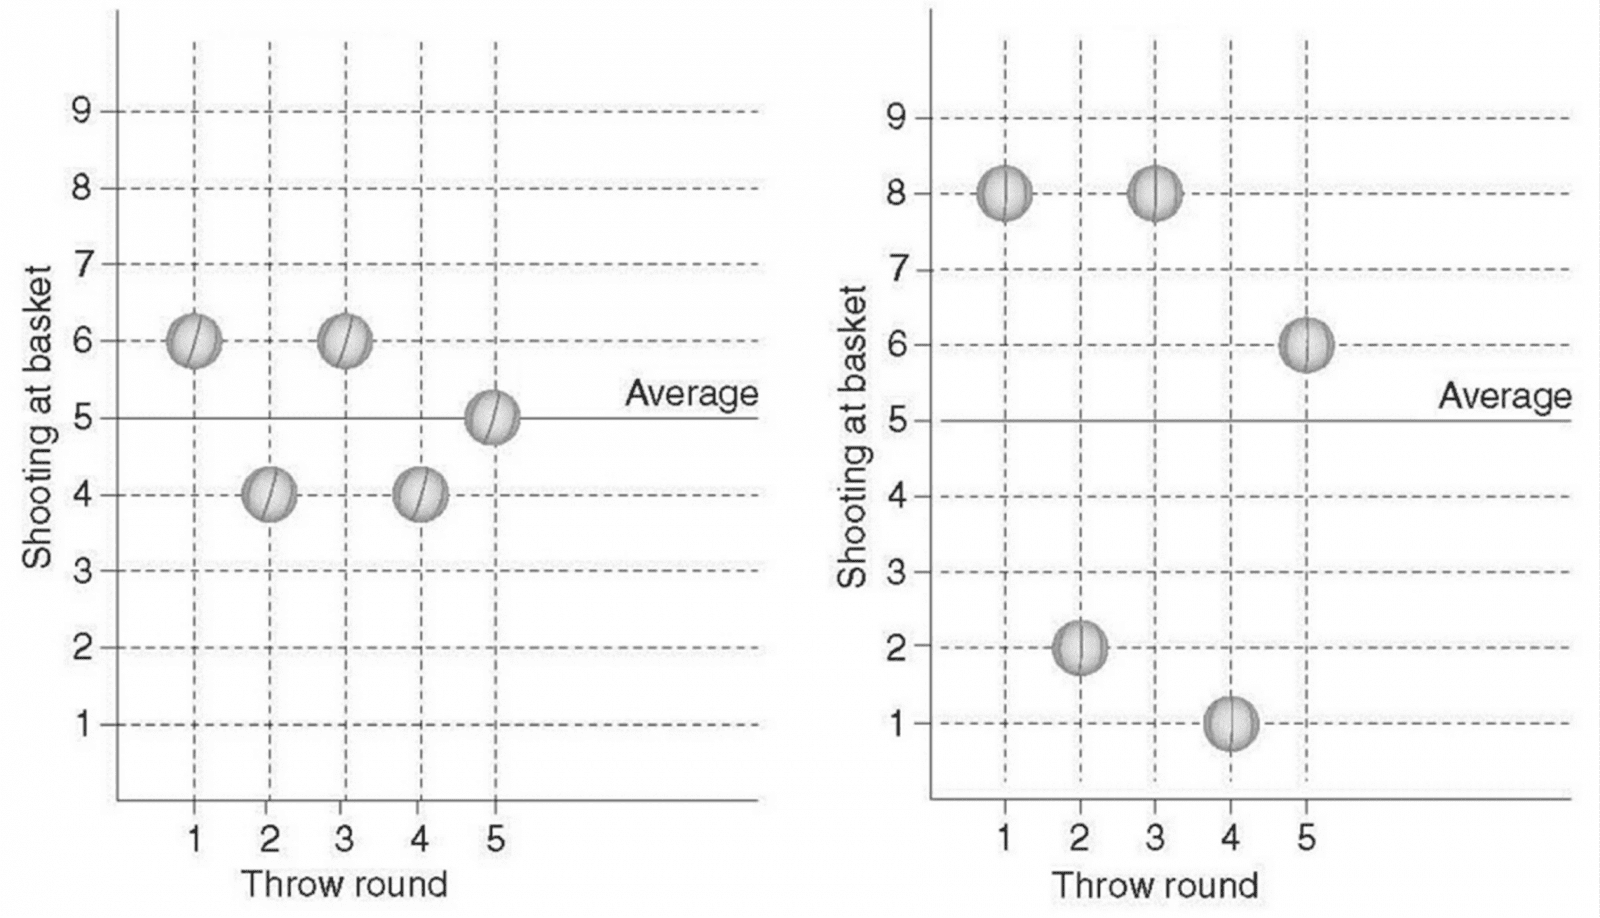
Players 3 and 4 scored the most baskets per round (5 baskets per round). The coach of the Dream Team must choose one of them, and asks you to help him make a choice. He also tells you two important facts:
-
The winner of last year’s tournament made an average of 4 baskets per round.
-
The coach will win $1 million if his representative wins.
Looking at the results, it is likely that you will choose player no. 3, because the volatility (the lack of consistency) in the number of baskets he made per round is lower and he will jeopardize the coach’s prize less than the other players.
Had player no. 3 demonstrated his current skill in last year’s competition, he would have had a good chance of winning, or at least sharing first place, since in no round did he score fewer than four baskets. Player no. 4, on the other hand, showed greater volatility between one round and another. Had he taken part in last year’s tournament, he might also have scored less than four baskets in the round.
Volatility (in Scoring) is Regarded as a Risk Factor
In the following explanation, we will use the word instability, instead of volatility. The following statements explain the relationship between instability and volatility in three situations:
-
Instability = Volatility
-
Complete stability = An absence of volatility
-
Greater stability = Less volatility
Most people believe that the volatile shooting of player no. 4 jeopardizes the coach’s prize more than the stability of player no. 3’s shooting, although both of these players made the same average number of baskets. In the financial sector, risk is linked to volatility. More risk is attributed to greater volatility.
Example:
Bill bought shares of two banks: Bank A and Bank B. He paid $1,000 for the shares he bought from each bank, making a total of $2,000. At the end of every month, the profits from his investments that month are reported to him and he records the results in a table.
The percentage of profit each month relates to the amount of the original investment.
For example, in the first month, he earned $10 (1% of $1,000) from bank A, and $30 (3% of $1,000) from bank B. He recorded the profit in the table as percentages.
In the second month, he earned $10 again (1%) from bank A, and lost $20 (-2%) from bank B. In the sixth month, he earned $10 again (1%) on bank A, and lost $50 (5%) on bank B.
Table 3.15 – Monthly Profit Data (as Percentages) for each of the Bank Shares
| Month | Shares of Bank A | Shares of Bank B |
| 1st month | 1% | 3% |
| 2nd month | 1% | -2% |
| 3rd month | 1% | 5% |
| 4th month | 1% | -3% |
| 5th month | 1% | 8% |
| 6th month | 1% | -5% |
| Average profit per month | 1% | 1% |
The percentage of profit relates to the original investment ($1,000 in the shares of each bank).
At the end of six months, Bill calculates his average profit on each bank, and is surprised to discover that, on the average, he earned 1% per month (or $10) per month from each of the banks – exactly the same amount. When we look at the volatility of profit from month to month, however, we see that profit from bank A was very stable, while profit from bank B was extremely volatile. Profit is unstable, and cannot be counted on.
In this situation, in which the two banks give us the same average monthly profit, we will prefer to invest in the shares with less volatility; in other words, in the shares whose monthly profit is more stable.
A Measure of Volatility
We will return to the basketball example. The choice of player no. 3 over player no. 4 in that example was made solely according to a superficial impression. Economists, however, have developed a tool for evaluating volatility that is both more scientific and amazingly simple. This tool is called the standard deviation, denoted by the Greek letter σ.
Standard deviation of player no. 4.
Demonstration for calculating standard deviation using a table
-
Column 2 – the number of baskets made in each round is inserted. The average (5 baskets) is inserted in row 6. The letter M is customarily used to denote the average.
-
Column 3 – the average is inserted into all of the column 3 entries.
-
Column 4 reflects the difference between the number of baskets made in each round (column 2) and the average number of baskets (column 3).
-
Column 5 is the square of the difference that appears in column 4 (for example, in row 4, (-4)2 =16). The sixth row is the average of the first five rows in the column (8.8).
-
Column 6 represents the standard deviation. It is calculated in two steps: working out the average of column 5 (8.8) and taking its square root (2.966).
The use of the word distance instead of difference:
In many situations, it is more appropriate to use the term “distance from the average” instead of the term “difference from the average”.
For example, when measuring the height of children, it is more appropriate to say: “The distance between the result and the average is 20 cm” than: “The difference between the result and the average is 20 cm”.
Table 3.16
| No. of Round | Number of Baskets in Round | Average no. of Baskets (M) | Difference Between no. of baskets and average | Square of Difference | Square Root |
| Round 1 | 8 | 5 | 3 | 9 | |
| Round 2 | 2 | 5 | -3 | 9 | |
| Round 3 | 8 | 5 | 3 | 9 | |
| Round 4 | 1 | 5 | -4 | 16 | |
| Round 5 | 6 | 5 | 1 | 1 | |
| 5 (average) | 8.8 (average) | √8.8=2.966 standard deviation |
Units of Measurement for Standard Deviation
The standard deviation is measured using the same units as the results data.
-
When the data involves the heights of children in centimeters, the standard deviation is measured in centimeters.
-
When the data involve the number of baskets made, the standard deviation is measured in baskets made.
-
When the data represent the weight of fish in kilograms, the standard deviation is measured in kilograms.


