


The PPC divides these products into two groups, which are essentially the two uses of GDP. This breakdown can be performed in the following ways:
-
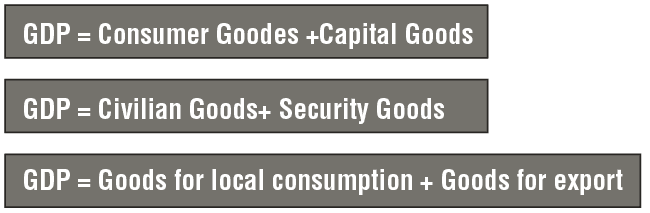
GDP = Consumer goods + Capital goods.
-
GDP = Civilian goods (used by civilians) + Security goods (used by security forces).
-
GDP = Goods for local consumption + Goods for export.
This chapter uses the division in which: When looking at the PPC, GDP can be divided into two groups (its technical limitations mean that a PPC can only show two items or products). The sources and uses report can divide GDP into many categories and sub-categories.
At times, it may be necessary to use money terms on a PPC curve. In this case, it is assumed that the price of every production unit is $1.
Example
The following diagram illustrates the PPC curve for Country E, and divides GDP into consumer goods and capital goods. The units shown in the curve all have the same value (every unit, whether for consumption or capital investment purposes, is worth $1 million).
At Point A, the country divides its wealth into 500 units of savings and 500 units of consumption. The country’s GDP is 500 + 500 = 1,000.
At Point B, the country divides its wealth into 300 units of savings and 700 units of consumption. The country’s GDP is 300 + 700 = 1,000.
Note that at any point on the PPCs , which includes all possibilities for the country’s production, the sum of consumption and savings will always be the same i.e., GDP will always equal 1,000.
The following table presents a sources and uses report for Country E at Point B on the previous PPC.
Use of the term “sources and uses report”
-
When the country imports from abroad, the term sources and uses report is used.
-
When the country does not import from abroad, the term GDP and its uses is used.
Table 4.13
GDP and its uses for Country E
|
Sources |
Uses |
|
GDP 1,000 |
Consumption (consumer products) 700 Gross investment (capital goods, savings) 300 |
|
Total 1,000 |
Total 1,000 |


