


This example refers to the PPC for bread and shoes in the following diagram:
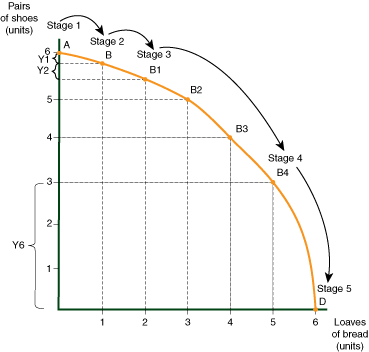
- Point A represents Stage 1, in which the country produces six pairs of shoes and no loaves of bread.
- Point B on the PPC represents Stage 2, in which the country decides to produce one loaf of bread. Segment Y1 on the Y-axis reflects the price that the country pays for this first loaf of bread: ¼ pair of shoes. In this case, the marginal cost of one loaf of bread is ¼ pair of shoes.
- Point B1 on the PPC represents Stage 3, in which the country wishes to produce a second loaf of bread. Segment Y2 on the Y-axis reflects the price that the country pays for this second loaf: 1/3 pair of shoes. The marginal cost of the second loaf of bread is 1/3 pair of shoes, a bit more than the marginal cost of the first loaf.
- Point B4 represents Stage 4, In which country bakes five loaves of bread.
- Point D represents Stage 5, in which the country decides to add a sixth loaf. Segment Y6 on the Y-axis shows the price that the country pays for the sixth loaf: 3 pairs of shoes. The marginal cost of the sixth loaf of bread is 3 pairs of shoes.
In this example, the marginal cost increases with each loaf of bread produced.


