Overview
The demand curve illustrates the quantities of items that consumers wish to purchase of at any given market price.
The demand curve in the diagram displays the demand for trousers in Country A. In general, as the market price for trousers increases, consumers will wish to buy fewer trousers.
Contrariwise, as the price decreases, consumers will wish to buy more trousers. In Country A, the actual price for trousers will be determined by the amount of trousers that manufacturers produce at each different price, which can be demonstrated on the supply curve.
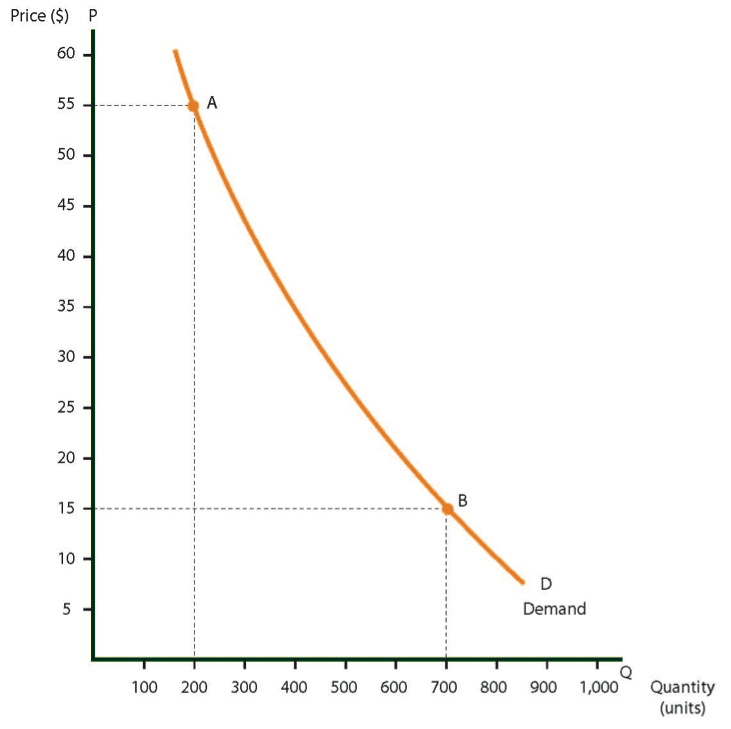
Demand curve for trousers in Country A

The structure of the curve
The axes of the demand curve are similar to those of the supply curve:
- X axis represents the quantity of goods.
- Y axis represents the price of goods.
The curve descends from left to right.
Symbols
- The letter D symbolizes the curve itself (Demand).
- The letter Q symbolizes the X-axis (Quantity).
- The letter P symbolizes the Y-axis (Price).
How to Read the Demand Curve
Version A:
- If the price of trousers is $55 (point A), then consumers of Country A will want to buy 200 pairs of trousers during the year.
- If the price of trousers falls to $15 (point B), then consumers will want to buy 700 pairs of trousers during the year.
Version B:
- Consumers of Country A will want to buy 200 pairs of trousers during the year only if the price of trousers is $55 (point A).
- Consumers will want to buy 700 pairs of trousers during the year only if the price of trousers is $15 (point B).
Every point on the curve provides two pieces of information:
- Price of a pair of trousers .
- Quantity of trousers that consumers want to buy at that price
Characteristics of the Demand Curve
- The curve descends from left to right, and is concave in most cases. The significance of a concave curve will be explained later.
- Consumption habits, different types of behavior, and other factors in a country (when the demand curve is drawn) affect the quantity of trousers demanded. A change in any one of these will usually shift the demand curve (either upward or downward). Please see the following explanation.
- The demand curve is particularly pertinent when it reflects the preferences of an entire population consisting of many consumers. Such demand is called aggregate demand. Aggregate demand consists of the total demand of large groups of people, for example the population of an entire country or region.
- The volume of demand indicated on the X-axis is usually the volume for an entire year, but this can also involve different time periods.
A Shift in the Demand Curve
The phrase “a shift in the demand curve” is used when, for some reason, the original curve (in this case D0) no longer reflects the current state of demand, and a new curve, D1 or D2, takes its place.
The Direction of the Shift in the Demand Curve
Two terms are used to describe the position of the new curve in comparison to the old one: above or below the old curve, and to the left or right of the old curve. The following diagram displays three demand curves:
- When the shift is from D0 to D1, we say that the curve has shifted to the right or upwards.
- When the shift is from D0 to D2, we say that the curve has shifted to the left or downwards.
Shifts in the demand curve

Variables that Cause Shifts in the Curve
Many variables, such as changes in wages and changes in consumer preferences, can cause shifts in the curve. The following examples illustrate the shifts in the demand curve that are caused by these variables.
Example 1: An increase in wages:
A general increase in wages will encourage consumers to buy more products. If people were previously willing to buy 50 pairs of trousers when the price was $20, then they will want to buy 80 pairs at $20 after an increase in wages. Consumers earning higher wages will want to buy more trousers at the same price. A shift in the demand curve to the right (or upwards) reflects this new situation on the graph. As seen in the diagram, D0, the demand curve, shifts to D1, a new curve.
Shifts in the demand curve

Example 2: A change in consumer preferences:
A change in consumer preferences can cause either a rightward or leftward shift in the demand curve.
For example, if consumers prefer wearing shorts to wearing trousers for some reason, then the demand curve for shorts will move upward, and the demand curve for trousers will move downward.