


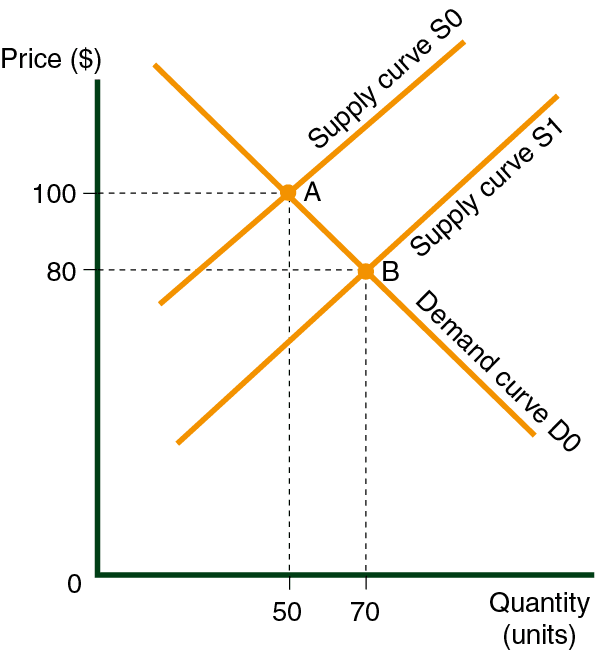
The following diagram displays the supply and demand curve for trousers in Country A (S0 and D0). The equilibrium price is at point A, where the price is $100 and the quantity sold is 50 pairs per year.
The total amount of money spent by consumers on trousers is $5,000 ($100 x 50 pairs).
This is also the amount of money received by the manufacturer, assuming that there is no gap (such as middlemen) between the consumer and the manufacturer.
The money recieved by the trouser manufacturers is called revenue, or more exactly, revenue from the sale of trousers. Revenue at point A is $5,000. If, for some reason, the supply curve shifts from S0 to S1 after three months, then revenue increases to $5,600 ($80 x 70 pairs of trousers).
Another Definition of Demand Curve Elasticity at a Specific Point
-
If the revenue increases from its starting point (point A in our example) when the price of a product drops, then the demnd curve is elastic at point A.
-
If the revenue decreases when the price of a product drops, then the demand curve is inelastic t point A.
-
If the revenue doesn’t change when the price of a product drops, then the curve is in unit elasticity at point A. (elasticity = 1).


